
Welcome to my blog!
My name is Ilya, I am a demographer. Here I plan to post some research related stuff. As I am crazy about R, my post will touch upon this tool/environment – I will share some tricks and cool visualizations. Eventually, I hope to contribute to the amazing R-bloggers project. First, I am going to post older bits – to gain momentum.
Just to start with, let me show you a small and handy self-written R function.
Quite often, visualizing data in R, we compose color palettes manually. It is nice to have a function that shows the actual colors of a vector with color values. Here it is.
The function takes a vector of colors as input and produces a basic uniform histogram with one bar for each color, filled accordingly. Let’s try it out. First, we create some colors, and then visualize them.
library(RColorBrewer)
pal <- brewer.pal(n = 9, name = 'BrBG')
glimpse_colors(pal)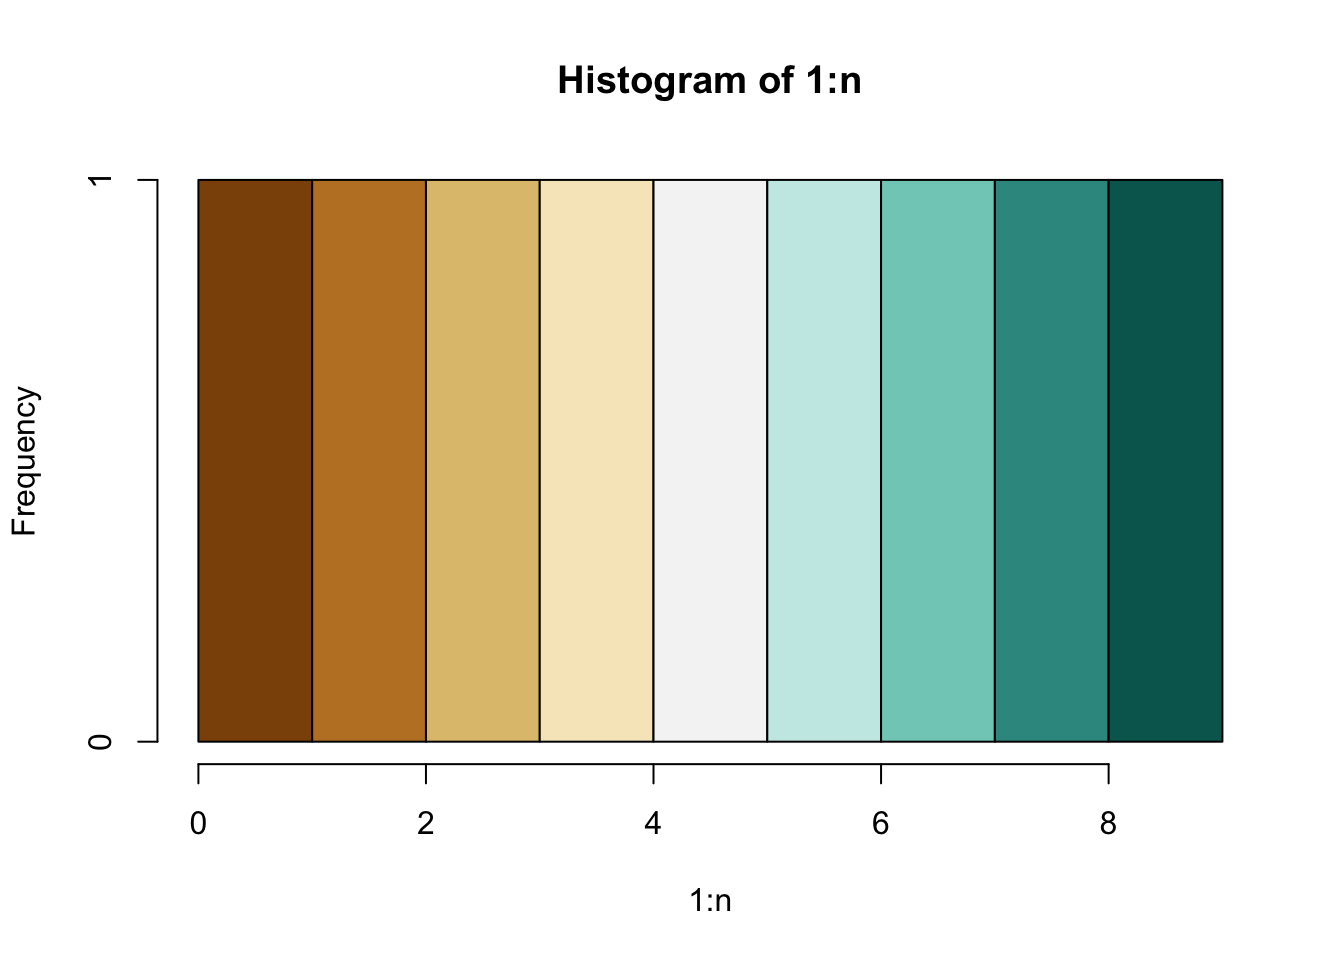
Enjoy!
P.S. If something similar exists in one of the well known packages, please tell me.